
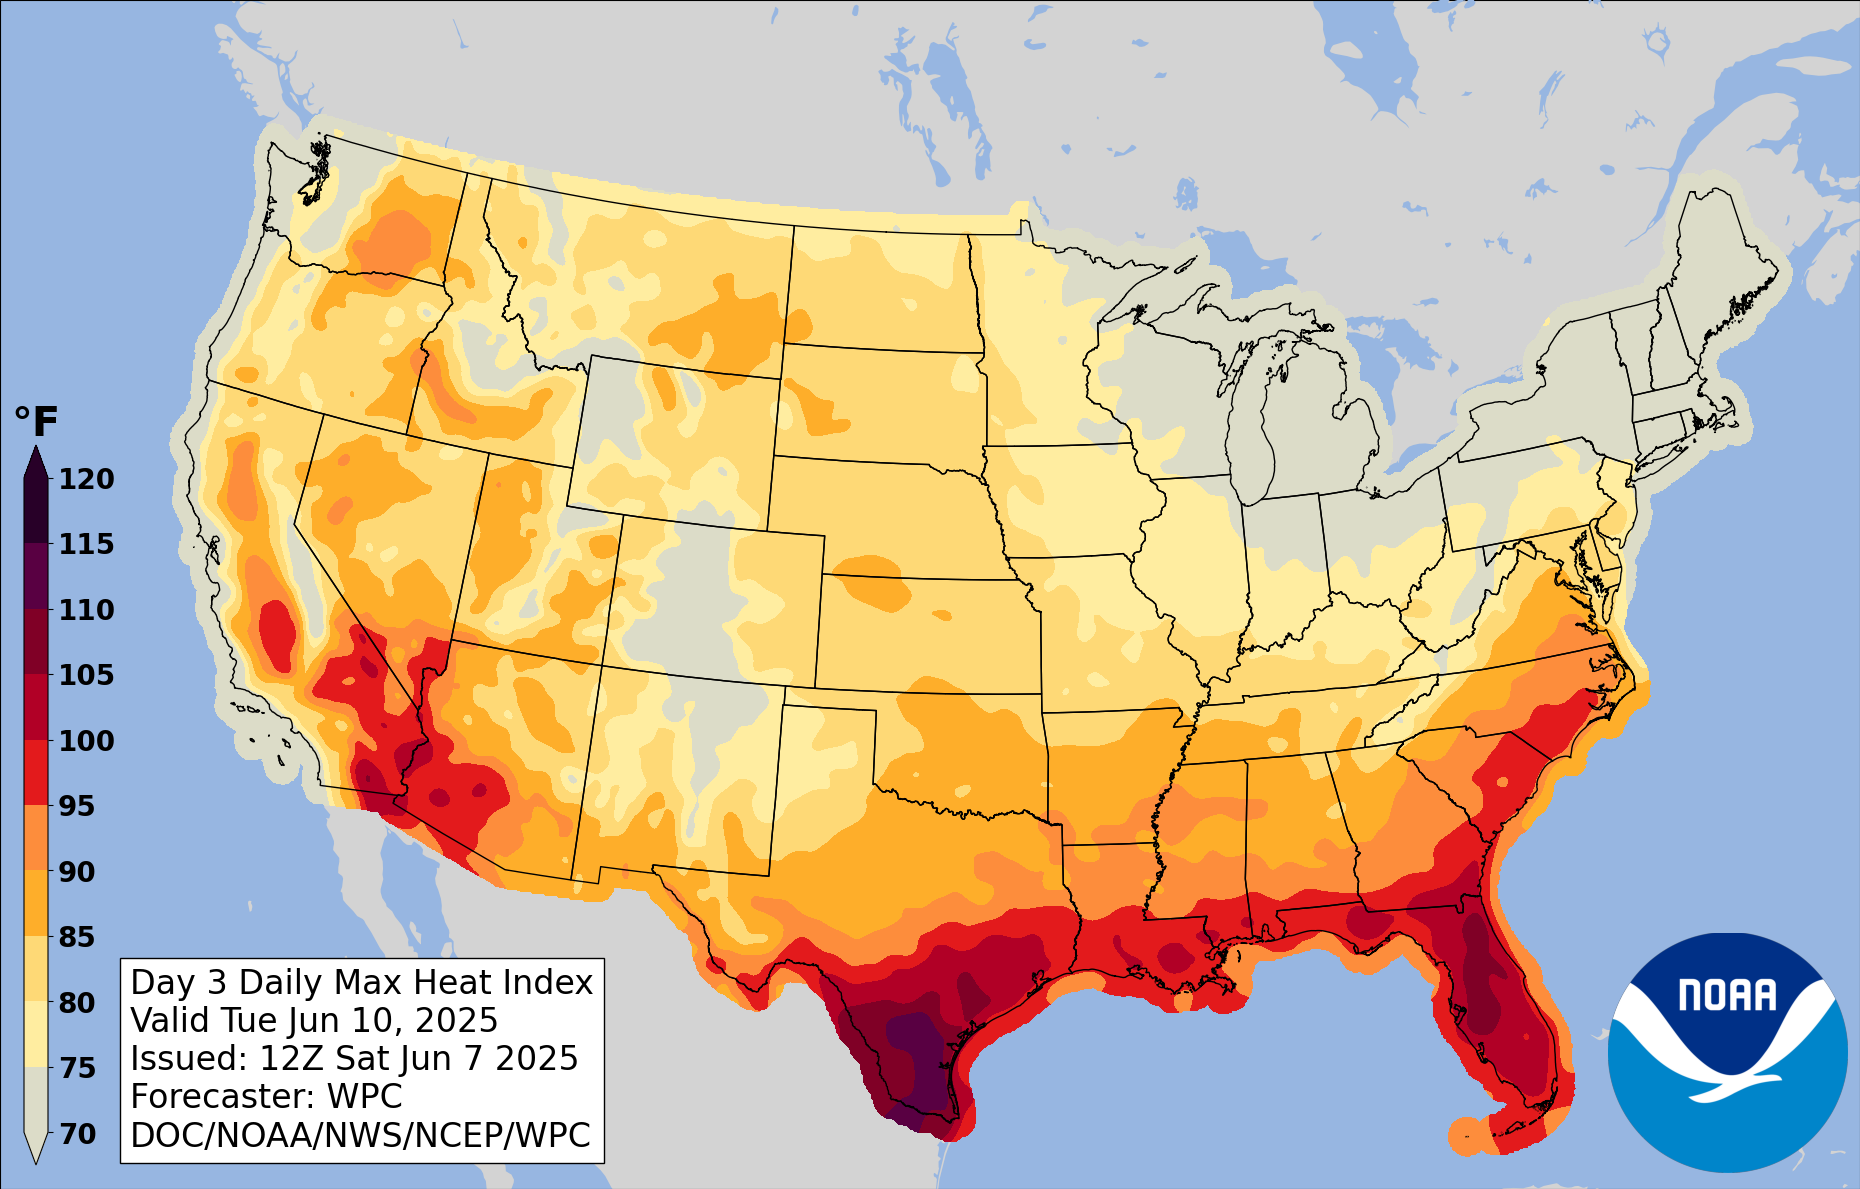
WPC Day 3-7 Heat Index Forecasts
|
|
|
Use Left/Right Arrow Keys
|
About |
Tabular Data West US |
Tabular Data East US |
Heat Index Calculator |
Additional Heat Information
These heat index products are issued by WPC twice per day at approximately 02Z and 16Z for the valid
days 3 through 7. They are based on an ensemble of model and human forecasts. Deterministic plots
indicate the most likely forecast while probabilistic plots depict the chance of exceeding various
thresholds. Plots are available for daily maximum, mean, and minimum heat index.
The uncertainty information for the heat index probability forecasts is obtained from an ensemble
composed ensemble members from the Global Forecast Ensemble System, the Global Ensemble Prediction
System, and the ECMWF Ensemble Prediction System. The probability of the maximum, minimum, or mean
heat index exceeding a threshold is computed on the assumption of normal distribution of probability
centered on the WPC determinstic forecast using a standard deviation equal to the spread of the
ensemble. These calculations are done separately at each grid point.
Official forecasts of instantaneous apparent temperatures (e.g., heat index or wind chill)
are available from the NWS National Digital Forecast
Database (NDFD).