Slide 21 of 45
Notes:
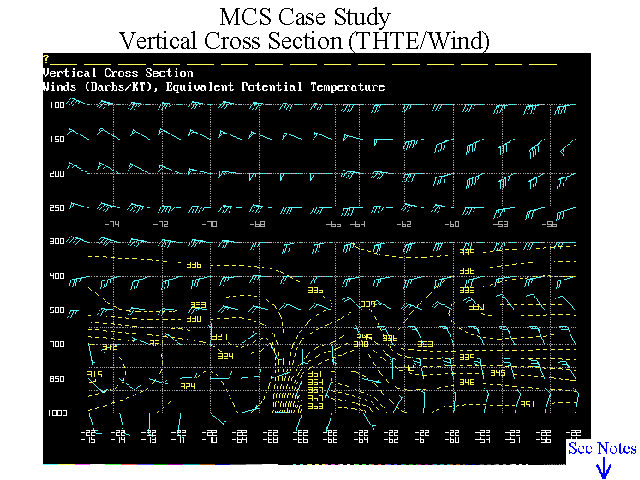
To further the understanding of an MCC/MCS there is nothing better than a vertical cross section. This chart shows the winds from the sfc to 100 hPa. Notice the cyclonic circulation between 22S 66W and 22S 62W, extending vertically to about 600 hPa. The equivalent potential temperature was overlayed�showing a warm maxima over this trough�once again showing the dependance of this system on latent heat of condensation for fuel.


