Slide 11 of 18
Notes:
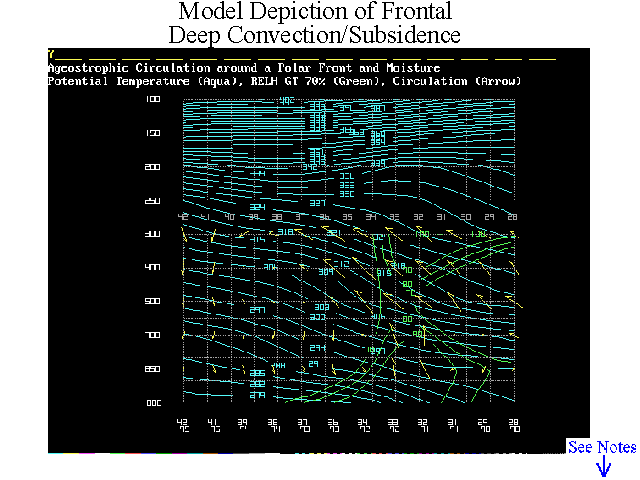
Potential Temperature (Aqua), Vertical Motion (Yellow Arrow), Relative Humidity GT70% (Green).
This chart shows the same frontal boundary, however emphasis was now placed on the relative humidity and the vertical displacement. Note the 70% contour extending well above 300 hPa…confirming the previous expectation of deep convection.


